Case-study 3: Literacy in 19th-century Spain
This case-study relies on the report published by authorities that summarised the information collected in the 1860 Spanish Population Census. In particular, it focuses on the number of men and women living in each Spanish district (partido judicial) classified according to whether they were illiterate, able to read or able to read and write.
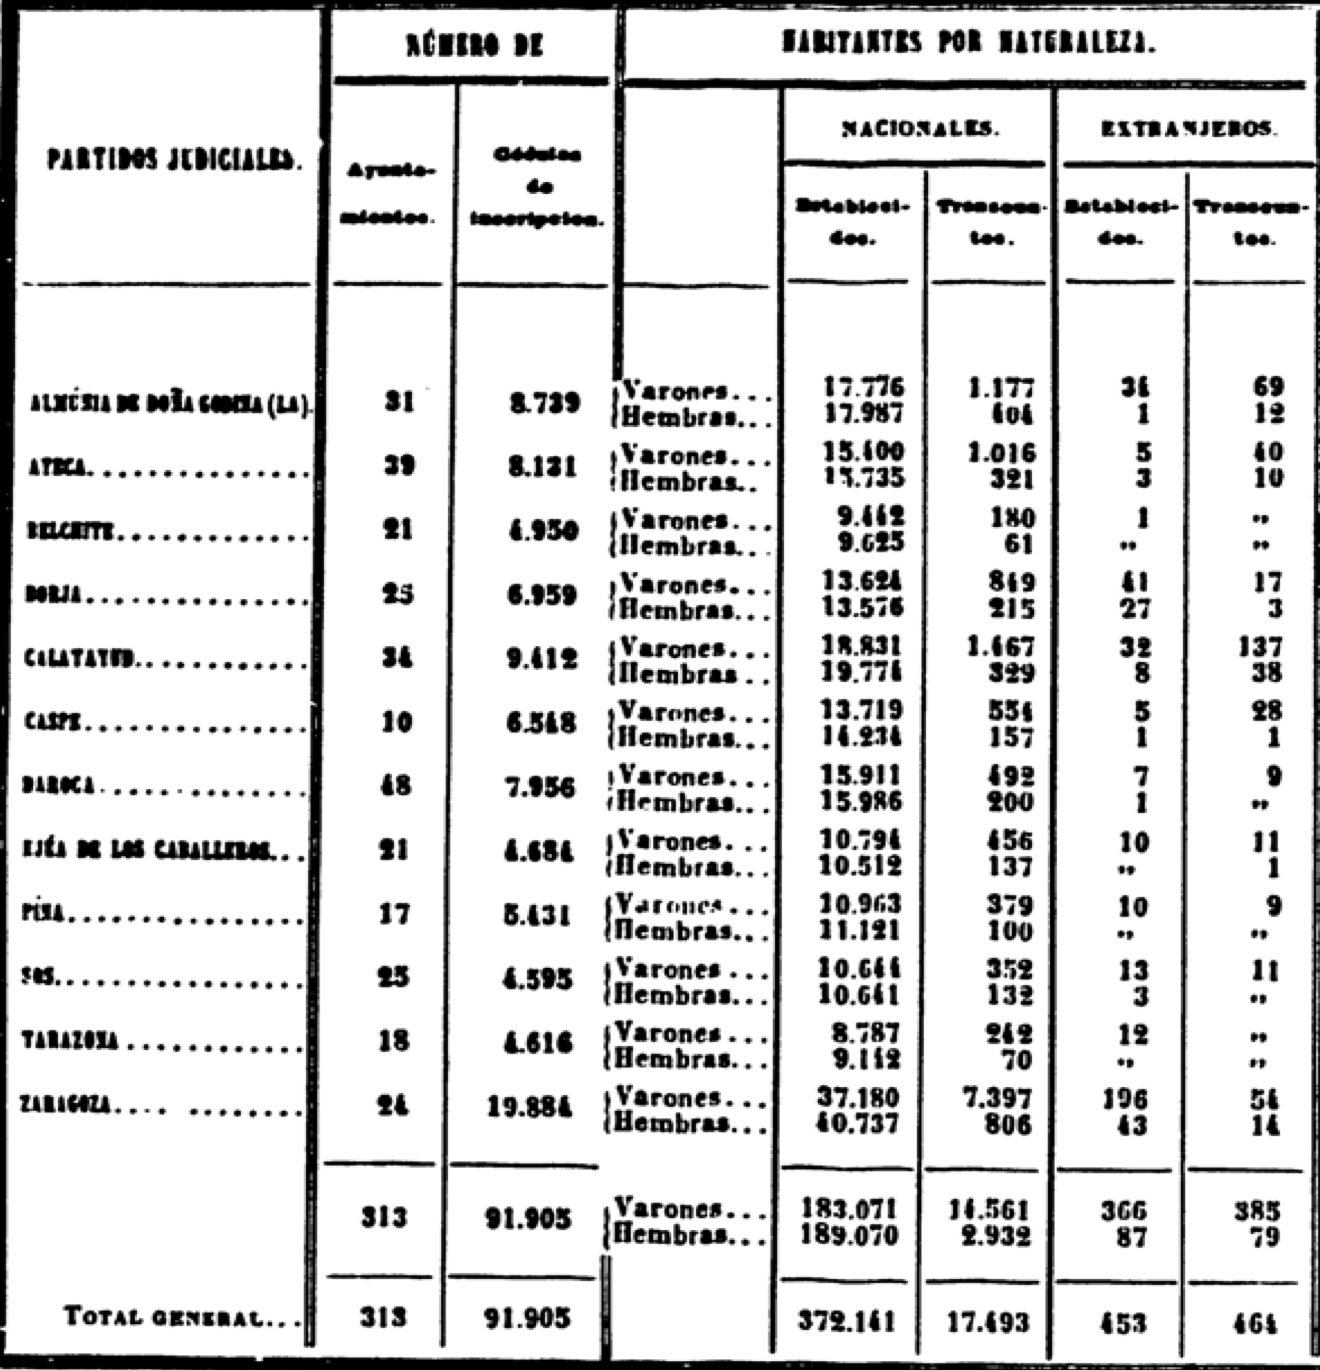
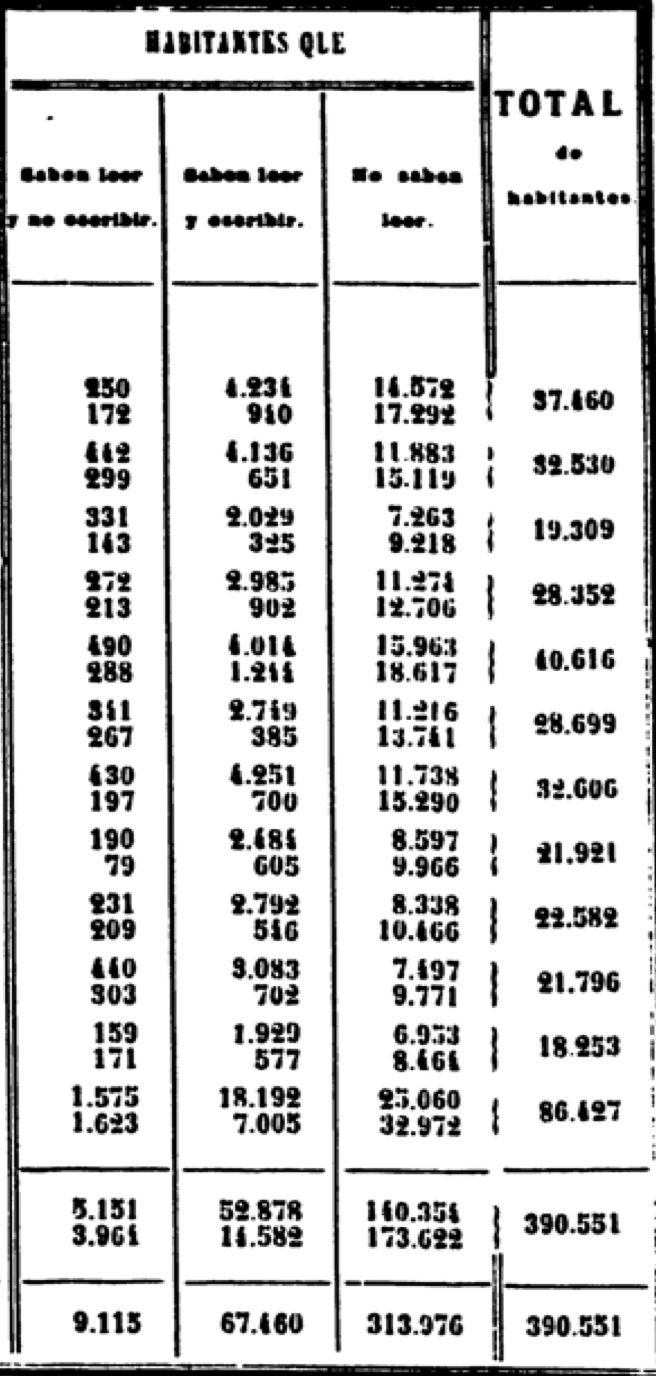
As the figure above illustrates, this source presents mostly numerical information, neatly structured in rows and columns, that can be easily transferred to a digital version. The sources contains information on the number of municipalities and households in each district, how many household (or the number the total number of men and wom
This is a very simple file reporting the number of individuals
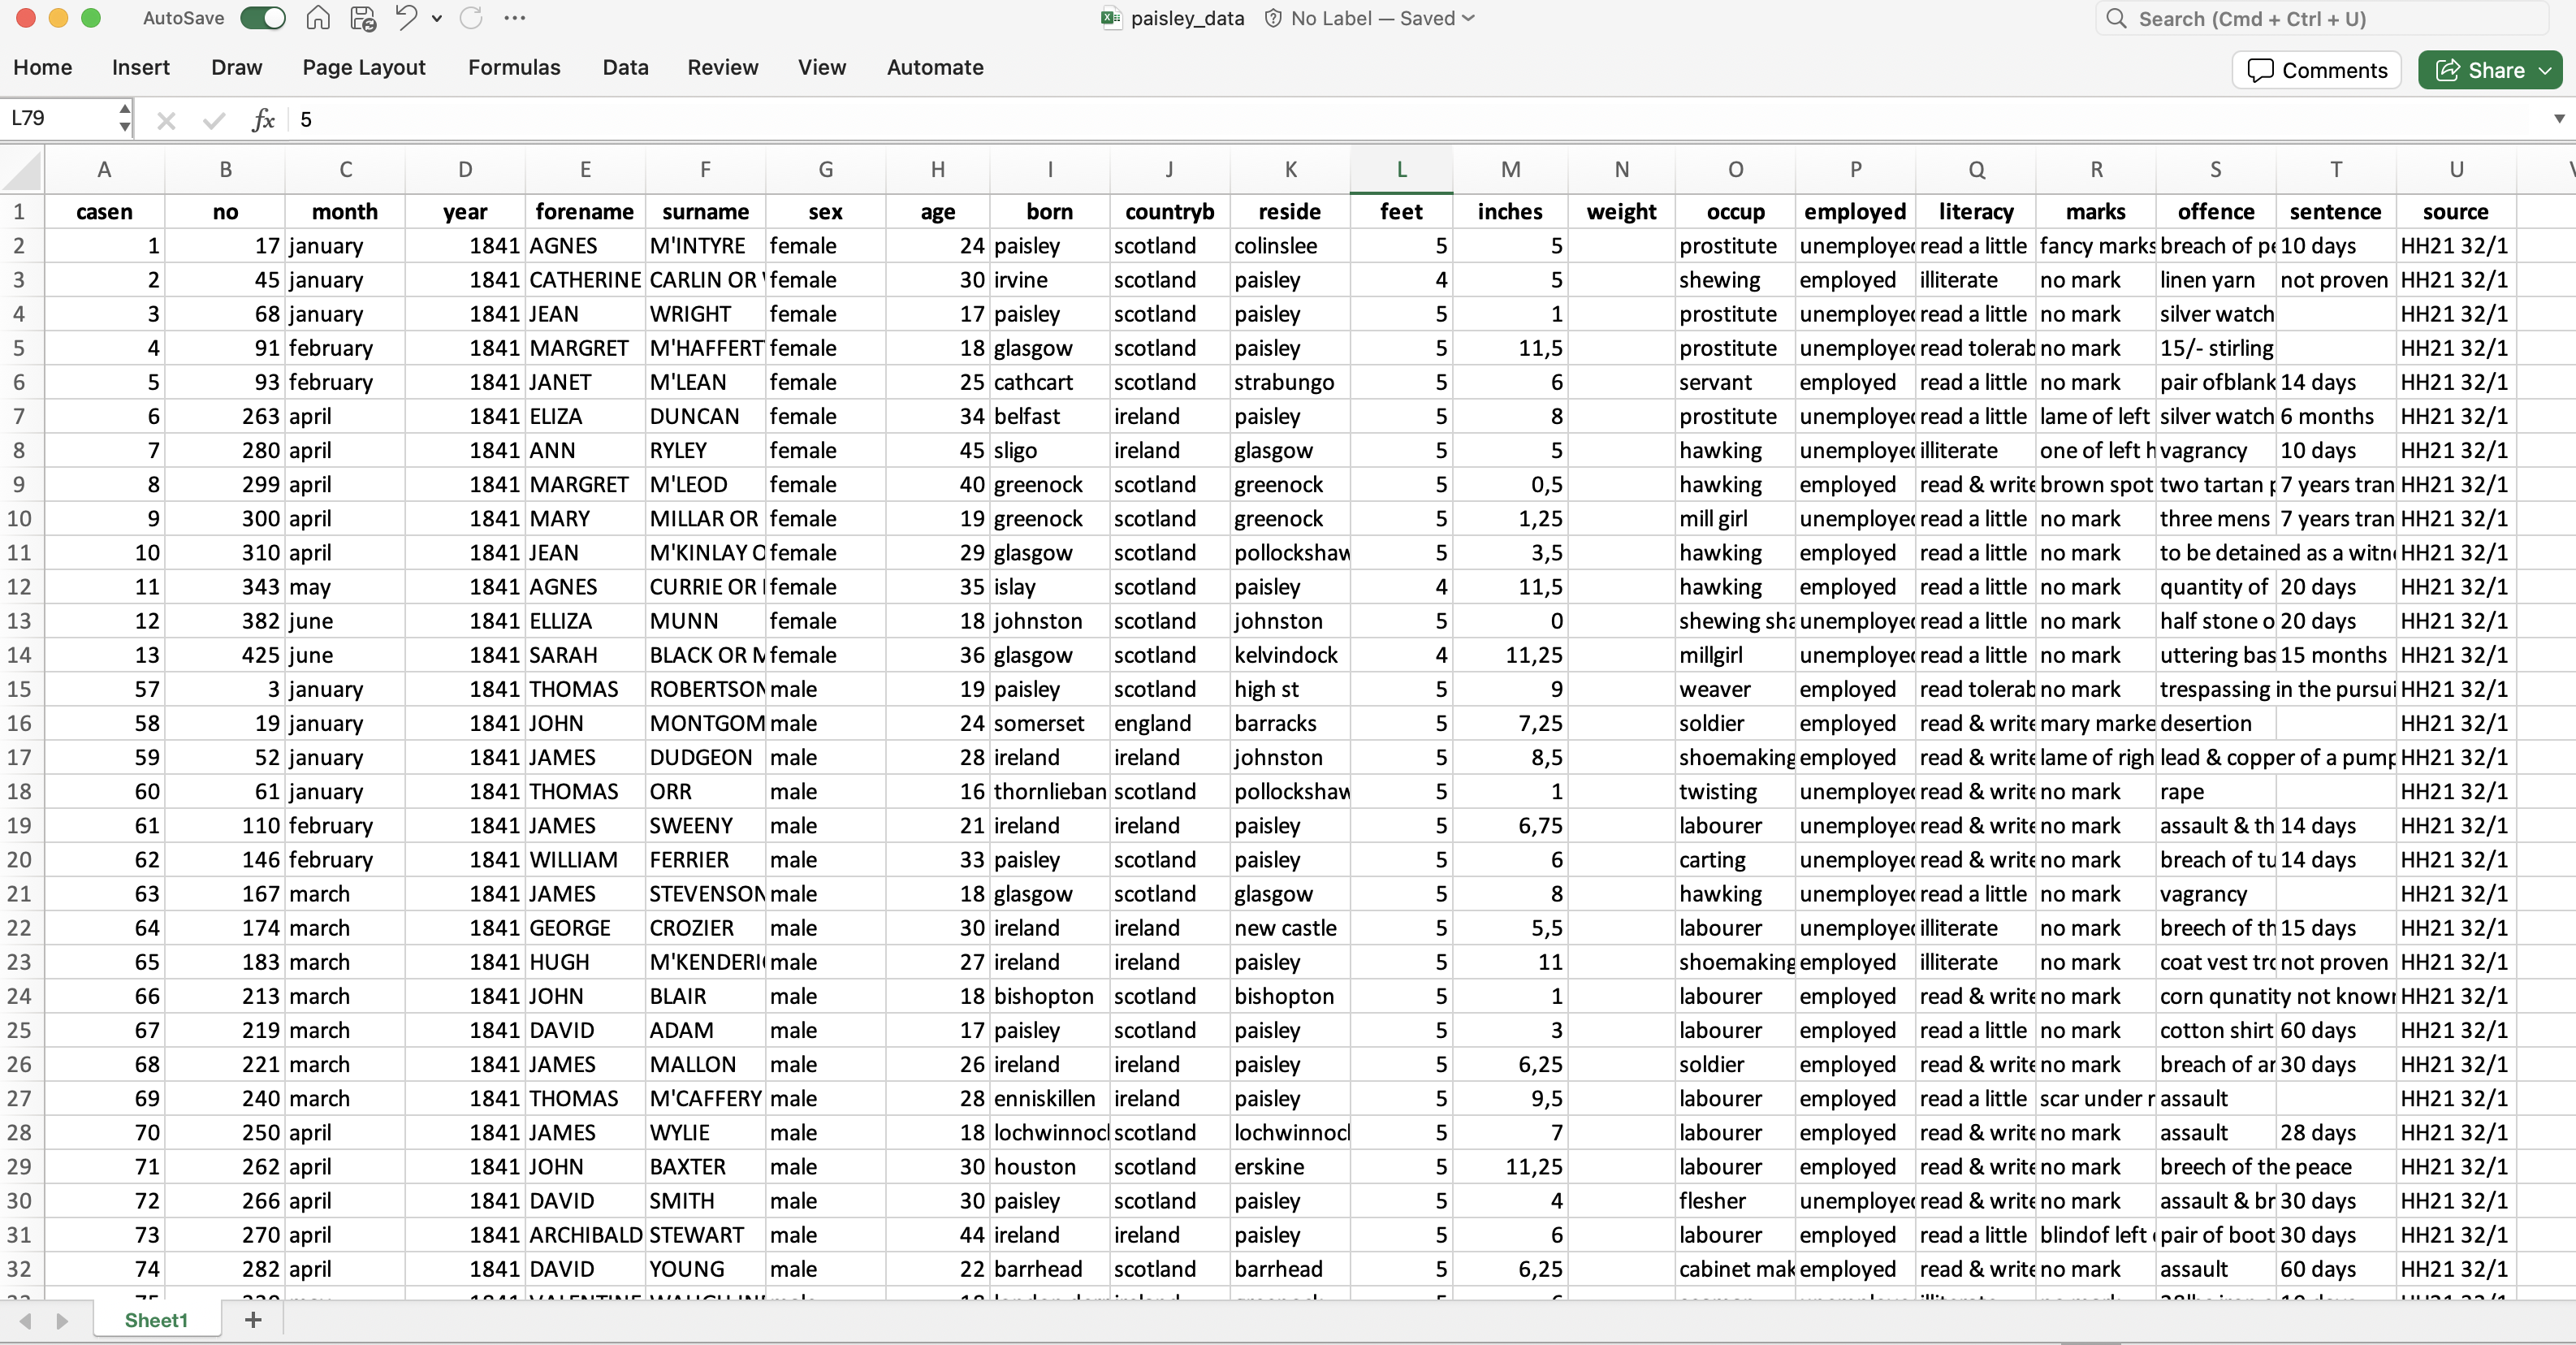
Inputing the raw data into an Excel spreadsheet results in Figure 2 below. Each column, known as field or variable presents a piece of information. As well as the case number (casen) and the date of admission (information that is split in two fields: month and year), the source records several pieces of information about these inmates, such name and surname, sex, age, place of birth (born) and country of birth (countryb), the place where the were living before being imprisoned (reside), height (in feet and inches) and weight, occupation (occup) and whether they were employed or not. It also reports their literacy, the marks that were visible in their bodies, the offence they committed and the sentence they received. While the first row displays the name of these variables, the remaining rows are devoted to each individual in the dataset.
Who were these prisoners? Where they were coming from? Did prisoners’ occupations differ significantly from the rest of the population? What about literacy rates? Did men and women commit different crimes? Did judges treat everyone equally or did particular groups suffer harsher sentences? What explains the variation in stature and weights observed across prisoners? How did theses dimensions change during the period? The range of historical questions that this source can address is almost endless. Sarah Horrell, David Meredith and Deborah Oxley have relied on this information to significantly contribute to our understanding of 19th-century British society, especially regarding the biological living standards of the working classes and the gender dynamics that drove the allocation of resources within these families [Horrell and Oxley (2013); Meredith and Oxley (2015)).1 We strongly encourage reading those pieces to get to know more about the source and its possibilities. Bear in mind that, for practical reasons, we will rely on a subset of the full data set, containing a thousand prisoners.2
This type of source allows exploring many historical questions:
How did the biological living standard of living change during the period?
What explains the variation in stature observed across prisoners?
Did prisoners’ occupations differ significantly from the rest of the population?
What about literacy rates?
Did men and women commit different crimes?
Did judges treat everyone equally or did particular groups suffer harsher sentences?
…
District-level information (464 observations; partido judicial) on:
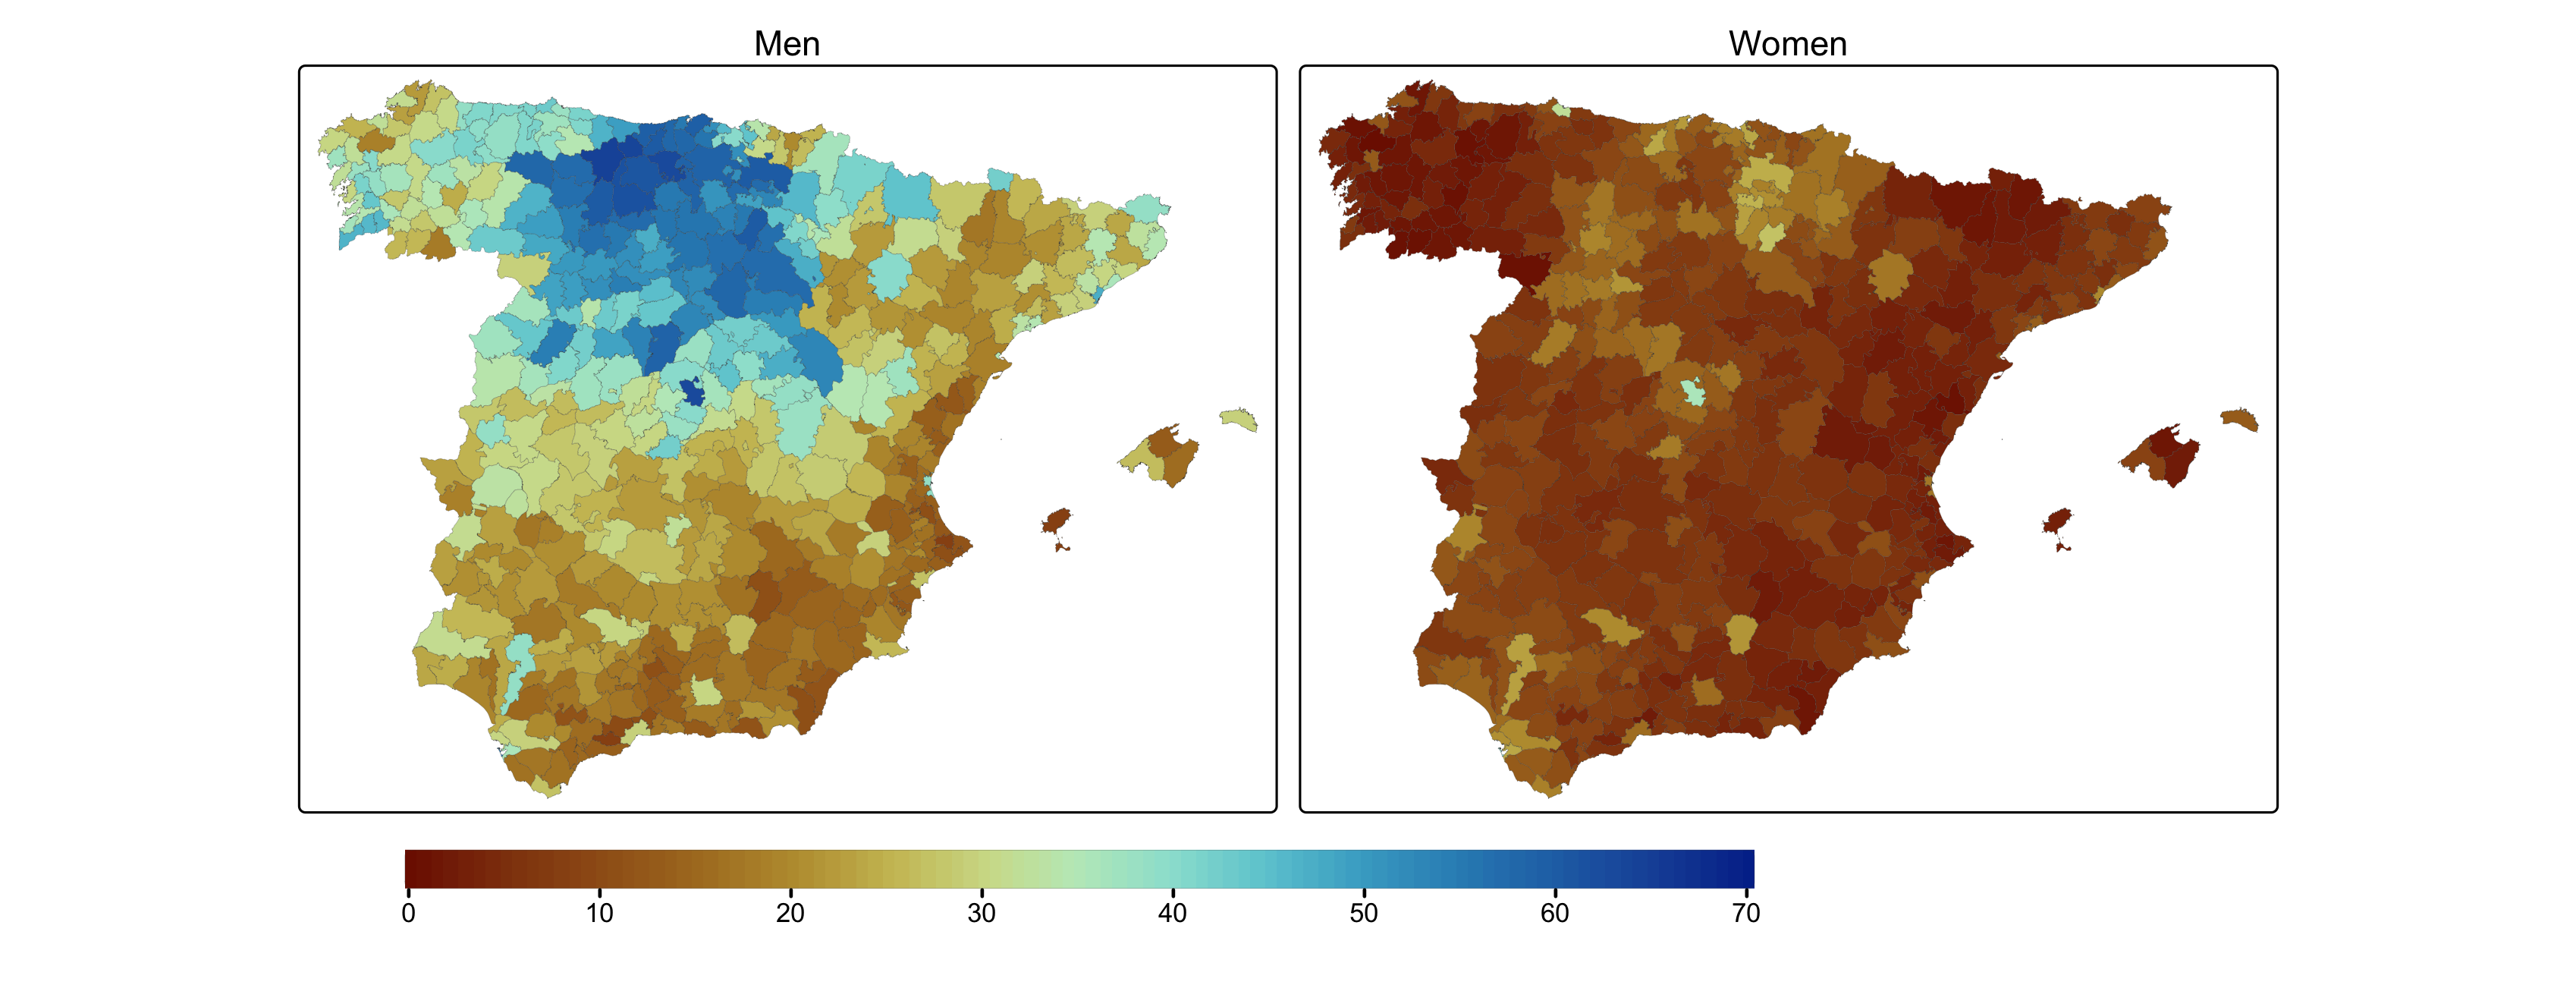
Literacy and education: schoolteachers (male and female), school enrollment (boys and girls) and literacy rates (ability to read and write) for men and women. Data
Occupations: number of individuals working on different occupational groups (i.e. landowners, landless labourers, tenants, factory workers, miners, artisans, liberal occupations, clergy, army, etc.). Data
Age structure, marital status and migrants: number of males and females classified by age-group (i.e. 0–1, 1–5, 6–10, etc.), number of singles, married and widows (by sex) and number of migrants (transeuntes). Data
Settlement pattern: number of households and municipalities plus the number of different type of settlements (i.e. ciudades, villas, lugares, aldeas, grupos and caseríos). Data
Shapefile with administrative boundaries.
Further references
Footnotes
In a seminal paper, Sarah Horrell and Deborah Oxley had previously addressed these issues using similar registers from the Wandsworth prison, near London (Horrell, Meredith, and Oxley 2009).↩︎
We are extremely grateful to Deborah Oxley and Hamish Maxwell-Stewart for kindly sharing the Paisley dataset.↩︎